The graph you get will look like a version
of the one below. The means and SD for each sample drawn are provided in the
graph (control condition on the left, experimental condition on the right).
The
two groups differ in how close they are to their true means, and as a
consequence, the difference between groups varies as well. Note that this
difference is the main variable in statistical analyses when comparing two
groups. Run at least 10 more simulations to look at the data pattern.
Assignment 3
Compared
to the one-sample case above, we now have 2 variable group means, and two
variable standard deviations. If we perform a power analysis, how do you think
this additional variability will influence the power of our test? In other
words, for the exact same effect size (e.g., 0.6667), will the power of our
study remain the same, will it increase, or will it decrease?
Test
whether your intuition was correct or not by running this power analysis for an
independent samples t-test:
pwr.t.test(d=0.6667,n=10,sig.level=0.05,type="two.sample",alternative="two.sided")
In dependent samples, the mean in one sample correlates with the
mean in the other sample. This reduced the amount of variability in the
difference scores. If we perform a power analysis, how do you think this will
influence the power of our test?
Effect
size calculations for dependent samples are influenced by the correlation
between the means. If this correlation is 0.5, the effect size calculation for
the dependent case and the independent case is identical. But the power for a
dependent t-test will be identical to the power in a one-sample t-test.
Verify
this by running the power analysis for a dependent samples t-test, with a true effect size of 0.6667, and compare the power
with the same power analysis for a one-sample t-test we performed above:
pwr.t.test(d=0.6667,n=10,sig.level=0.05,type="paired
",alternative="two.sided")
Variation across studies
Up until know, we have talked about the
variation of data points within a single study. It is clear that the larger the
sample size, the more the observed difference (in the case of two means) or the
more the observed correlation (in the case or two related variables) mirrors
the true difference or correlation. We can calculate the variation in the effects we are interested in directly.
Both correlations are mean differences are effect sizes. Because mean
differences are difficult to compare across studies that use different types of
measures to examine an effect, or different scales to measure differences on,
whenever multiple effect sizes are compared researchers often use standardized
effect sizes. In this example, we will focus on Cohen’s d, which provides
the standardized mean difference.
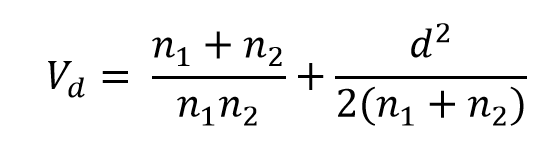
As explained in Borenstein, Hedges,
Higgins, & Rothstein (2009) a very good approximation of the variance of d is provided by:
This formula shows that the variance of d depends only on the sample size and
the value of d itself.
Single study meta-analysis
Perhaps you remember that whenever the 95%
confidence interval around an effect size estimate excludes zero, the effect is
statistically significant. When you want to test whether effects sizes across a
number of studies differ from 0, you have to perform what is known as a meta-analysis. In essence, you perform
an analysis over analyses. You first analyze individual studies, and then
analyze the set of effect sizes you calculated from each individual study. To
perform a meta-analysis, all you need are the effect sizes and the sample size
of each individual study.
Let’s first begin with something you will
hardly ever do in real life: a meta-analysis of a single study. This is a
little silly, because a simple t-test
of correlation will tell you the same thing – but that’s educational to see.
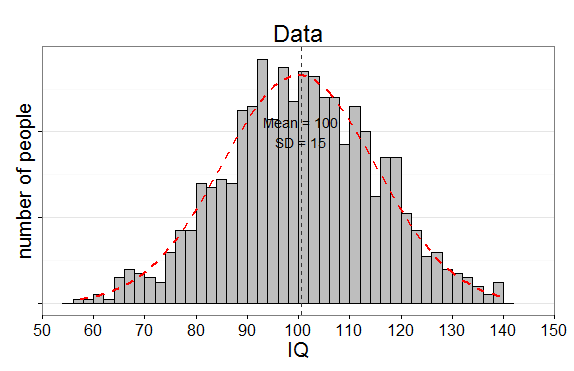
We will simulate one study examining our IQ
training program. The IQ in the control condition has M = 100, SD = 15, and in
the experimental condition the average IQ has improved to M = 106, SD = 15. We
will randomly select the sample size, and draw between 20-50 participants in each condition.
Our simulated results for a single
simulation (see the code below) for the control condition gives M=97.03, and
for the experimental condition gives M = 107.52. The difference (of the
experimental condition – the control condition, so lower scores mean better
performance in the experimental condition) is statistically significant, t(158) = 2.80, p = 0.007. The effect size Hedges’ g = 0.71. This effect size overestimates the true effect size
substantially. The true effect size is d
= 0.4 – calculate this for yourself.
Run
the code in assignment 6 (I'm skipping some parts I do use in teaching - feel free to run that code to explore variation in correlations) to see the data. Remove the # in front of the set.seed line to get
the same result as in this example.
Assignment
6
If we perform a
meta-analysis, we get almost the same result - the calculations used by the meta
package differ slightly (although it will often round to the same 2 digits
after the decimal point), because it uses a different (Wald) type of tests and
confidence interval – but that’s not something we need to worry about here.
Run the simulation a number
of times to see the variation in the results, and the similarity between the
meta-analytic result and the t-test.
The meta-analysis compares the
meta-analytic effect size estimate (which in this example is based on a single
study) to zero, and tests whether the difference from zero is statistically
significant. We see the estimate effect size g = 0.7144, a 95% CI, and a z-score (2.7178), which is the test
statistic for which a p-value can be
calculated. The p-value of 0.0066 is
very similar to that observed in the t-test.
95%-CI z
p-value
0.7143703 [0.1992018; 1.2295387] 2.7178 0.0066
Meta-analysis
are often visualized using forest plots. We see a forest plot summarizing our
single test below:
In this plot we see a number (1) for our
single study. The effect size (0.71), which is Hedges's g, the unbiased estimate of Cohen's d, and the confidence interval [0.2; 1.23]
are presented on the right. The effect size and confidence interval is also
visualized. The effect size by the orange square (the larger the sample size,
the bigger the square is) and the length of the line running through it is the
95% confidence interval.
A small-scale meta-analysis
Meta-analyses are made to analyze more than
one study. Let’s analyze 4 studies, with different effect sizes (0.44, 0.7, 0.28,
0.35) and sample sizes (60, 35, 23, 80 and 60, 36, 25, 80).
Researchers have to choose between a fixed effect model or a random effects model when performing a
meta-analysis.
Fixed effect models assume a single true effect size underlies all the
studies included in the meta-analysis. Fixed effect models are therefore
only appropriate when all studies in the meta-analysis are practically
identical (e.g., use the same manipulation) and when researchers do not want to
generalize to different populations (Borenstein, Hedges, Higgins, &
Rothstein, 2009).
By contrast, random effects models allow the true effect size to vary from study to
study (e.g., due to differences in the manipulations between studies). Note
the difference between fixed effect and random effects (plural, meaning multiple effects). Random effects models
therefore are appropriate when a wide range of different studies is examined
and there is substantial variance between studies in the effect sizes. Since
the assumption that all effect sizes are identical is implausible in most
meta-analyses random effects meta-analyses are generally recommended
(Borenstein et al., 2009).
The meta-analysis in this assignment, where
we have simulated studies based on exactly the same true effect size, and where
we don’t want to generalize to different populations, is one of the rare
examples where a fixed effect meta-analysis would be appropriate – but for
educational purposes, I will only show the random effects model. When variation
in effect sizes is small, both models will give the same results.
In a meta-analysis, a weighted mean is
computed. The reason studies are weighed when calculating the meta-analytic
effect size is that larger studies are considered to be more accurate estimates
of the true effect size (as we have seen above, this is true in general).
Instead of simply averaging over an effect size estimate from a study with 20
people in each condition, and an effect size estimate from a study with 200
people in each condition, the larger study is weighed more strongly when
calculating the meta-analytic effect size.
R makes it relatively easy to perform a
meta-analysis by using the meta or metafor package. Run the code related to Assignment 7. We get the following
output, where we see four rows (one for each study), the effect sizes and 95%
CI for each effect, and the %W (random), which is the relative weight for each
study in a random effects meta-analysis.
95%-CI %W(random)
1 0.44
[ 0.0802; 0.7998] 30.03
2 0.70
[ 0.2259; 1.1741] 17.30
3 0.28
[-0.2797; 0.8397] 12.41
4 0.35
[ 0.0392; 0.6608] 40.26
Number
of studies combined: k=4
95%-CI z p-value
Random
effects model 0.4289 [0.2317; 0.6261] 4.2631 < 0.0001
Quantifying
heterogeneity:
tau^2 =
0; H = 1 [1; 1.97]; I^2 = 0% [0%; 74.2%]
Test of
heterogeneity:
Q d.f.
p-value
1.78
3 0.6194
The line below the summary gives us the
statistics for the random effects model. First, the meta-analytic effect size
estimate (0.43) with the 95% CI [0.23; 0.63], and the associated z-score and p-value. Based on the set of studies we
simulated here, we would conclude it looks like there is a true effect.
The same information is visualized in a
forest plot:

The meta-analysis also provides statistics
for heterogeneity. Tests for
heterogeneity examine whether there is large enough variation in the effect
sizes included in the meta-analysis to assume their might be important
moderators of the effect. For example, assume studies examine how happy
receiving money makes people. Half of the studies gave people around 10 euros,
while the other half of the study gave people 100 euros. It would not be
surprising to find both these manipulations increase happiness, but 100 euro
does so more strongly that 10 euro. Many manipulations in psychological
research differ similarly in their strength. If there is substantial
heterogeneity, researchers should attempt to examine the underlying reason for
this heterogeneity, for example by identifying subsets of studies, and then examining
the effect in these subsets. In our example, there does not seem to be substantial
heterogeneity (the test for heterogeneity, the Q-statistic, is not
statistically significant).
Assignment
7
Play around with the effect
sizes and sample sizes in the 4 studies in our small meta-analysis. What
happens if you increase the sample sizes? What happens if you make the effect
sizes more diverse? What happens when the effect sizes become smaller (e.g.,
all effect sizes vary a little bit around d = 0.2). Look at the individual
studies. Look at the meta-analytic effect size.
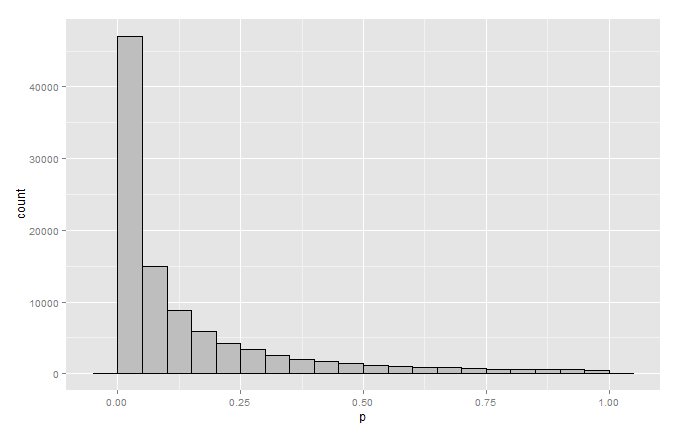
Simulating small studies
Instead of typing in specific number for
every meta-analysis, we can also simulate a number of studies with a specific
true effect size. This is quite informative, because it will show how much
variability there is in small, underpowered, studies. Remember that many
studies in psychology are small and underpowered.
In this simulation, we will randomly draw
data from a normal distribution for two groups. There is a real difference in
means between the two groups. Like above, the IQ in the control condition has M
= 100, SD = 15, and in the experimental condition the average IQ has improved
to M = 106, SD = 15. We will simulate between 20 and 50 participants in each
condition (and thus create a ‘literature’ that consists primarily of small
studies).
You can run the code we have used above
(for a single meta-analysis) to simulate 8 studies, perform the meta-analysis,
and create a forest plot. The code for Assignment 8 is the same as earlier, we
just changed the nSims=1 to nSims=8.
The forest plot of one of the random
simulations looks like:
The studies show a great deal of
variability, even though the true difference
between both groups is exactly the same in every simulated study. Only 50% of
the studies reveal a statistically significant effect, but the meta-analysis
provides clear evidence for the presence of a true effect in the fixed-effect
model (p < 0.0001):
95%-CI %W(fixed) %W(random)
1 -0.0173 [-0.4461; 0.4116] 14.47 13.83
2 -0.0499 [-0.5577; 0.4580] 10.31 11.16
3 0.6581 [ 0.0979; 1.2183] 8.48 9.74
4 0.5806 [ 0.0439; 1.1172] 9.24 10.35
5 0.3104 [-0.1693; 0.7901] 11.56 12.04
6 0.4895 [ 0.0867; 0.8923] 16.40 14.87
7 0.7362 [ 0.3175; 1.1550] 15.17 14.22
8 0.2278 [-0.2024; 0.6580] 14.37 13.78
Number of studies combined: k=8
95%-CI z p-value
Fixed effect model 0.3624 [0.1993; 0.5255] 4.3544 < 0.0001
Assignment
8
Pretend these would be the
outcomes of studies you actually performed. Would you have continued to test
your hypothesis in this line of research after study 1 and 2 showed no results?
Simulate at least 10 small
meta-analyses. Look at the pattern of the studies, and how much they vary. Look
at the meta-analytic effect size estimate. Does it vary, or is it more
reliable? What happens if you increase the sample size? For example, instead of
choosing samples between 20 and 50 [SampleSize<-sample(20:50, 1)], choose
samples between 100 and 150 [SampleSize<-sample(100:150, 1)].
Meta-Analysis, not Miracles
Some
people are skeptical about the usefulness of meta-analysis. It is important to
realize what meta-analysis can and can’t do. Some researchers argue
meta-analyses are garbage-in, garbage-out.
If you calculate the meta-analytic effect size of a bunch of crappy studies,
the meta-analytic effect size estimate will also be meaningless. It is true
that a meta-analysis cannot turn bad data into a good effect size estimation.
Similarly, meta-analytic techniques that aim to address publication bias (not discussed in this blog post) can
never provide certainty about the unbiased effect size estimate.
However,
meta-analysis does more than just provide a meta-analytic effect size estimate
that is statistically different from zero or not. It allows researchers to
examine the presence of bias, and the presence of variability. These analyses
might allow researchers to identify different subsets of studies, some stronger
than others. Very often, a meta-analysis will provide good suggestions for
future research, such as large scale tests of the most promising effect under
investigation.
Meta-analyses are not always
performed with enough attention to
detail (e.g., Lakens, Hilgard, & Staaks, 2015). It is important to
realize that a meta-analysis has the potential to synthesize a large set of
studies, but the extent to which a meta-analysis succesfully achieves this is
open for discussion. For example, it is well-known that researchers on opposite
sides of a debate (e.g., concerning the question whether aggressive video games
do or do not lead to violence) can publish meta-analyses reaching opposite
conclusions. This is obviously undesirable, but points towards the large
degrees in freedom in choosing which articles to include in the meta-analysis,
as well as other choices that are made throughout the meta-analysis.
Nevertheless, meta-analyses
can be very useful. First of all, small scale-meta-analyses can actually
mitigate publication bias, by allowing researchers to publish individual
studies that show statistically significant effect and studies that do not show
statistically significant effect, while the overall meta-analytic effect size
provides clear support for a hypothesis. Second, meta-analyses provide us with
a best estimate (or a range of best estimate, given specific assumptions of
bias) of the size of effects, or the variation in effect sizes depending on
specific aspects of the performed studies, which can inspire future research.
That’s a lot of information
about variation in single studies, variation across studies, meta-analyzing
studies, and performing power analyses to design studies that have a high
probability of showing a true effect, if it’s there! I hopethis is helpful in designing studies and evaluating their
results.